Source Code Deep Dive

Engineers have to read the source code. Some more often, some less often, but in the end everyone has to. It is not enough to know the syntax of the language, one must be able to quickly find the codepath of interest and understand the paths of program execution.
In this article I am going to tell you about some tools that will help you do that. But first I would like to decide when it is time to take the plunge.
It’s time to
Usually the job of admin/devops/sre is pretty standard. It consists of reading documentation for various software, matching the solution to the task, deployment and operations. During operations, or during deployment, there are more questions than the documentation has answers. The system is further investigated as a black box: an assumption is made and tested empirically by changing the configuration/data input/runtime environment/etc.
This method is universal, which is a plus. As the experience and theoretical base grows, the efficiency of the engineer increases, he gets used to investigating black boxes, from the description of the architecture he can figure out expected bottlenecks and limits of software. But, in some cases, finding the answer this way can be very time-consuming.
A trigger can be anything: unexpected reactions to commands/configuration, seeming bugs, lags. Finding tuning opportunities is a whole separate topic.
In such a situation, you can surely ask the developers of the software. Unfortunately, they are people too. They may have a lot of work, family, vacations, kids, the beach, the covid. It can be anything, because of which they can give an answer when it is already late. It can also be really hard to come up with a question.
As a result, it is cheaper in terms of time to dive into the source code of the program to an operations engineer and understand what it is all about. And there are always miracles waiting there. Abstractions are often implemented in code in a different way than it seems after reading the doc, and the killer feature turns out to be a terrible kludge
Here I would like to warn the engineer. Working with source code is not easy. Yes, sometimes you can understand a very important point of the program in 15 minutes. But all the projects are different. Some are large, some are poorly structured and some are developed by academics and use a lot of language-specific abstractions. Sometimes it is very difficult to find the root of the problem. Sometimes it’s even difficult for the development team of that software, what can we say about a lone engineer from the outside? That’s why it’s important to develop an understanding of when it’s time to stop.
Scheme
We take it as a rule: as soon as you open the source code and see that you need to look through more than one function - start graphical mapping of the code. Remember everything at once in the new software is impossible, to keep a large context in your head is a torture. Therefore it is important to draw function calls that we are interested in as flowcharts.
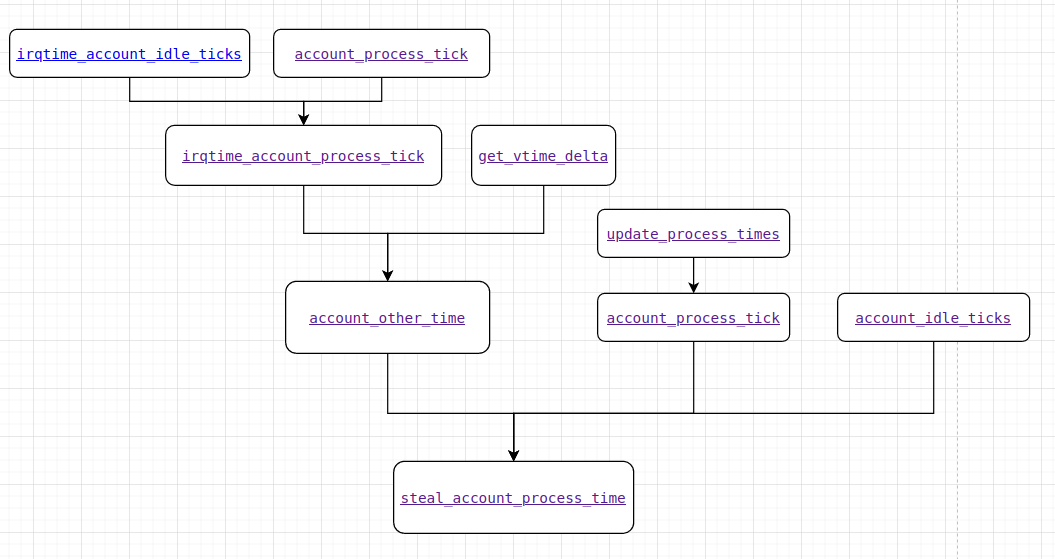
It is not important to adhere to any particular format of display, the main thing is to make it clear to the drawer what is happening. It is advisable to copy the links to the source code, so that it is possible to go from the schematic to the desired part of the code. I use [diargams.net][https://www.diagrams.net/] for that. A simple diagram might look like this:

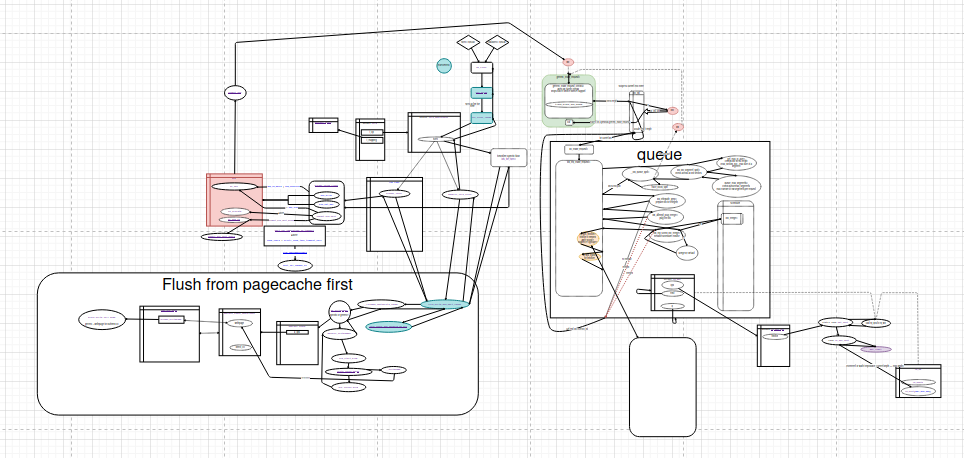
A more complicated one looks like this:

The diagram doesn’t have to be complete, covering all the source code around the entry point. It is enough to describe the main points, which are the most interesting for us right now. I.e. when tracking changes in some data structure, you can start with a description of this structure and functions interacting with it. Most likely, we are interested in a couple of contexts within which the structure changes. It is not necessary to set ourselves the task of completely rendering all the interactions in the code. It’s complicated, expensive and unnecessary.
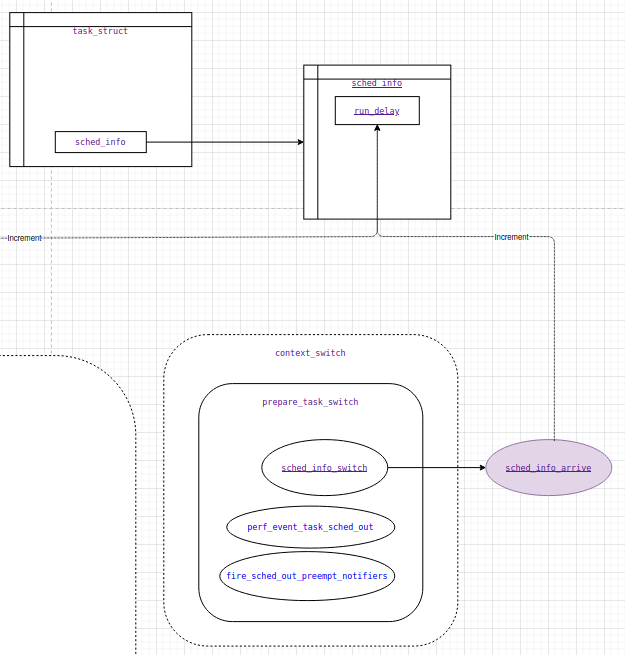
And this is, for example, what run_delay counter increment looks like called from the sched_info_arrive function called from sched_info_switch in the prepare_task_switch context within context_switch in the Linux kernel:

It’s important to note the abstractions that are used in the code. Any way you like. The main goal is to capture the part of code of interest at the moment, so you don’t have to keep everything in your head.
Yes, you could call it a mess. It may be not very clear to the reader exactly what is shown here and why it is so. But the fact is that it becomes much easier to navigate in code if you draw a scheme of how the components - functions and data structures interact. You can even return to the diagram later and quickly restore the mental context.
main()
Entering into the code of an unfamiliar program from the main() function is almost always useless. It is only necessary when we are interested in the initialization of the program, but in general - not our way.
Errors
Errors are a good thing. They are our guide to the source code. If software writes an error to the log or complains to the stderr about a command, you can take the text of the error and properly grep the sources. The same applies to all log entries in general.
Ideally above the code we will immediately see what caused the error. But it may turn out that different paths lead to the error. You may try to read the code and pretend to be a processor and find out which path we are interested in. But usually it is faster to dump stack samples by event or by timer.
Slightly more convenient than grep is vgrep. At least it’s more convenient to look for function description, you can quickly open needed file. For C/C++ code there is cscope, but it is more heavyweight and requires learning.
Traceback
Cooler than an error message is a calltrace. The stacktrace turns out a matryoshka of function calls. For us it’s a way to better understand the path the processor traveled through the code, and thus better understand the state of the program at the time of failure.
In the source code you can find all functions specified in the trace and see how the request was processed. Sometimes this is enough to determine the wrong value somewhere among the variables, or a corner case.
Obvious and unpleasant thing is that calltrace will not show the calls of functions which have influence on processed request, but finished execution before stack dumping. I.e. if in one function calls 10 other functions in a row and in 10th function program crashed and threw trace, then we will see only call of main function and this 10th function in it, although the problem may be in incorrect data processing somewhere among other 9 functions.
You don’t have to wait for a crash to catch a trace. You can use analysis tools such as perf or bpftrace.
Calltrace with perf/bpftrace
Calltrace can be taken either by a specific function call or periodically at a given interval. The first option works well if we want to get the code path to a called function that we know. The second variant fits in the general case when we want to understand what is running in the system as a whole.
For both, we need to look at the documentation. Here it is important that if the number of events is huge, the output can be very big and you can affect the client load. So you have to measure the entries somehow and not print every call to the screen. You can do this with bpftrace, for example:
~# bpftrace -e 'k:tcp_sendmsg {@[kstack] = count();} i:s:1 {print(@); clear(@);}'
Attaching 2 probes...
@[
    tcp_sendmsg+1
    sock_sendmsg+92
    sock_write_iter+147
    new_sync_write+293
    __vfs_write+41
    vfs_write+177
    ksys_write+167
    __x64_sys_write+26
    do_syscall_64+87
    entry_SYSCALL_64_after_hwframe+68
]: 1
@[
    tcp_sendmsg+1
    sock_sendmsg+92
    ____sys_sendmsg+512
    ___sys_sendmsg+136
    __sys_sendmsg+99
    __x64_sys_sendmsg+31
    do_syscall_64+87
    entry_SYSCALL_64_after_hwframe+68
]: 2181
...
Here we see two paths of tcp_sendmsg calls: one happened just once and the other occurred 2181 times. In this case we didn’t get the output on every call, but on a timer, one second after the start. This is a more efficient way than dumping every function call.
For normal operation of the debugger and profiler we need information about the addresses of the functions. This information can be available from the frame pointer, for that the software must be built with the
-fno-omit-frame-pointerflag. But this may affect the performance of the application. Another option is to use debug symbols. If you build your own, you can not cut the symbols from the binary (do not callstripduring the building process), then the file size increases, but this is the most convenient to use. It is possible to build debugging symbols in a separate package, as many maintainers of popular distributions do.perfcan use dwarf with the--call-graphdwarf argument.
When sampling a stack by timer it is recommended to set the sampling rate (-F for perf) to some non-round number. For example, 199. The point is that there is a risk of running into some task that is executing at the profiler start frequency. Most timers in the system are set by programmers, and they often use round or multiples of 5. If some function runs fast and its context is not on the stack when the profiler is running, we won’t see it. You can go to Brendan Gregg`s site for great examples on perf.
kprobes/uprobes
If we know the name of a function and want to understand, for example, the arguments for calling that function or the frequency of the call, we can use the same tools as above. In fact, in the previous example I already used the kernel probe (kprobe).
On the bcc example I have already written about using probes to get information from kernel structures in some detail.
Sampling works pretty much the same way as a debugger, using a breakpoint mechanism. The first bytes of the instruction, on which the sample is hinged, are replaced by a breakpoint. When the breakpoint is called, the trap is triggered and execution goes to the bpf program we prepared. If you want to understand the details, it is worth reading the documentation. In short, as usual, no magic, everything by the blueprint.
Not everything is smooth here either. Sometimes you want to get information about a function, but it turns out to be inlined at compile time. This means that the compiler simply inserts the function code in all places where it is called in the source. This avoids the procedure of calling the function preserving the context and passing arguments. It does this by increasing the size of the executable, so it is popular for small functions. As a workaround you can try to find out the addresses in memory where parts of the code you are interested in are located and use perf to set a breakpoint for a code startup event from this location or for reading data from another location, e.g. the variable you are interested in. But figuring out the address of a variable can sometimes be really challenging.
gdb
The debugger is designed for debugging. Using gdb in production is risky because it easily causes the program to freeze.
In some cases you can use non-interactive mode of gdb in a production. But it happens that the debugger fails and the process remains paused. This is of course unacceptable:)
>$ sudo gdb -p 2004 -q --batch -ex 'thr app all bt full'
[New LWP 2007]
[New LWP 2008]
[Thread debugging using libthread_db enabled]
Using host libthread_db library "/lib/x86_64-linux-gnu/libthread_db.so.1".
0x00007f1bc4206cf9 in __GI___poll (fds=0x56040cf57800, nfds=7, timeout=-1) at ../sysdeps/unix/sysv/linux/poll.c:29
29      ../sysdeps/unix/sysv/linux/poll.c: No such file or directory.

Thread 3 (Thread 0x7f1bbbfff700 (LWP 2008)):
#0  0x00007f1bc4206cf9 in __GI___poll (fds=0x7f1bb400c5a0, nfds=5, timeout=-1) at ../sysdeps/unix/sysv/linux/poll.c:29
        resultvar = 18446744073709551100
        sc_cancel_oldtype = 0
#1  0x00007f1bc52546e9 in  () at /usr/lib/x86_64-linux-gnu/libglib-2.0.so.0
#2  0x00007f1bc5254a82 in g_main_loop_run () at /usr/lib/x86_64-linux-gnu/libglib-2.0.so.0
#3  0x00007f1bc58422d6 in  () at /usr/lib/x86_64-linux-gnu/libgio-2.0.so.0
#4  0x00007f1bc527c2a5 in  () at /usr/lib/x86_64-linux-gnu/libglib-2.0.so.0
#5  0x00007f1bc44ea6db in start_thread (arg=0x7f1bbbfff700) at pthread_create.c:463
        pd = 0x7f1bbbfff700
        now = <optimized out>
        unwind_buf = {cancel_jmp_buf = {{jmp_buf = {139757094958848, 8678067557208934083, 139757094956544, 0, 94575396732144, 140721220090416, -8765755809032845629, -8765912620801472829}, mask_was_saved = 0}}, priv = {pad = {0x0, 0x0, 0x0, 0x0}, data = {prev = 0x0, cleanup = 0x0, canceltype = 0}}}
        not_first_call = <optimized out>
#6  0x00007f1bc4213a3f in clone () at ../sysdeps/unix/sysv/linux/x86_64/clone.S:95

Thread 2 (Thread 0x7f1bc0f4d700 (LWP 2007)):
#0  0x00007f1bc4206cf9 in __GI___poll (fds=0x56040ceded90, nfds=1, timeout=-1) at ../sysdeps/unix/sysv/linux/poll.c:29
        resultvar = 18446744073709551100
        sc_cancel_oldtype = 0
#1  0x00007f1bc52546e9 in  () at /usr/lib/x86_64-linux-gnu/libglib-2.0.so.0
#2  0x00007f1bc52547fc in g_main_context_iteration () at /usr/lib/x86_64-linux-gnu/libglib-2.0.so.0
#3  0x00007f1bc5254841 in  () at /usr/lib/x86_64-linux-gnu/libglib-2.0.so.0
#4  0x00007f1bc527c2a5 in  () at /usr/lib/x86_64-linux-gnu/libglib-2.0.so.0
#5  0x00007f1bc44ea6db in start_thread (arg=0x7f1bc0f4d700) at pthread_create.c:463
        pd = 0x7f1bc0f4d700
        now = <optimized out>
        unwind_buf = {cancel_jmp_buf = {{jmp_buf = {139757178115840, 8678067557208934083, 139757178113536, 0, 94575396731984, 140721220090032, -8765920642361473341, -8765912620801472829}, mask_was_saved = 0}}, priv = {pad = {0x0, 0x0, 0x0, 0x0}, data = {prev = 0x0, cleanup = 0x0, canceltype = 0}}}
        not_first_call = <optimized out>
#6  0x00007f1bc4213a3f in clone () at ../sysdeps/unix/sysv/linux/x86_64/clone.S:95

Thread 1 (Thread 0x7f1bc5ef5900 (LWP 2004)):
#0  0x00007f1bc4206cf9 in __GI___poll (fds=0x56040cf57800, nfds=7, timeout=-1) at ../sysdeps/unix/sysv/linux/poll.c:29
        resultvar = 18446744073709551100
        sc_cancel_oldtype = 0
#1  0x00007f1bc52546e9 in  () at /usr/lib/x86_64-linux-gnu/libglib-2.0.so.0
#2  0x00007f1bc5254a82 in g_main_loop_run () at /usr/lib/x86_64-linux-gnu/libglib-2.0.so.0
#3  0x000056040b9d83b4 in  ()
#4  0x00007f1bc4113b97 in __libc_start_main (main=0x56040b9d7fc0, argc=1, argv=0x7ffc3655fdb8, init=<optimized out>, fini=<optimized out>, rtld_fini=<optimized out>, stack_end=0x7ffc3655fda8) at ../csu/libc-start.c:310
        result = <optimized out>
        unwind_buf = {cancel_jmp_buf = {{jmp_buf = {0, -3141639837352212797, 94575374730720, 140721220091312, 0, 0, -8676504790378232125, -8765913260049709373}, mask_was_saved = 0}}, priv = {pad = {0x0, 0x0, 0x7f1bc5d26783 <_dl_init+259>, 0x7f1bc5201a58}, data = {prev = 0x0, cleanup = 0x0, canceltype = -976066685}}}
        not_first_call = <optimized out>
#5  0x000056040b9d860a in  ()
But if you know how to reproduce the problem, gdb is a great tool on test stands. You can literally go step by step through the code and check variable states. You can even change the values of variables and see how it ends! And call functions, for example, from the standard library. You can kill a zombie process by calling waitpid() inside some donor process.
After all
Working with source code is difficult, but sometimes necessary.
To work efficiently you need to know the language syntax, know how to navigate the runtime, know how to use specific tools and know when to stop. This has powerful advantages when solving problems, but it’s also costly to start with.
Always draw a diagram. A graphical depiction of code is a very handy tool, allowing you to relax a little more when tackling a difficult task like finding a problem in your code.
Look for any way to clarify which part of the code to investigate. Errors, traces, debugger are our best friends in this case. Use modern tools and don’t be afraid of the unknown.